Your smart home sensors have access to a ton of data. Typically, you’ll use this data to trigger various home automation tasks, but why just react to data when you can record it? You’ll learn in his tutorial how you can record all your SmartThings sensor data to a Google spreadsheet.
Why is there a need to record data?
By recording data over time, you’ll have access to all the information you need to create a more streamlined, efficient smart home. For example, if you record all your temperature readings, you can measure how quickly each room takes to heat up and how long it takes to cool down. Armed with this information, you can refine your heating system to ensure each room remains at a comfortable temperature.
Having access to historical data can also help you identify any issues with your home. For example, if a particular room starts losing heat more quickly than before, then it may indicate an issue with your insulation or double glazing.
Even if you don’t wind up actually using this data, it can still make for interesting reading. How cold does it get in your garage overnight? How many hours do you spend in front of your smart TV on the average day? On you “cheat day,” how many times do you open the biscuit cupboard? If questions like these keep you up at night, you’ll learn how to get the answers!
Installing a SmartThings app from code
This tutorial uses Simple Event Logger, a smart app that pulls data from any compatible SmartThings sensor and uploads it to a Google Sheets document. Unlike the applications you’ll find in the SmartThings marketplace, Simple Event Logger is distributed as Groovy code.
You don’t have to be fluent with the Groovy programming language to use it, though. Simply copy/paste the ready-made code into the SmartThings Integrated Development Environment (IDE), and Simple Event Logger will appear in your SmartThings mobile app.
Set up the Simple Event Logger app
To set up this smart application, you’ll need to copy the Simple Event Logger code. Once you have this code copied to your clipboard:
- In your web browser, log into the SmartThings IDE with the email address and password associated with either your Samsung or your SmartThings account.
- Depending on the setup of your smart home, you may need to select “My Locations” and then your smart home hub.
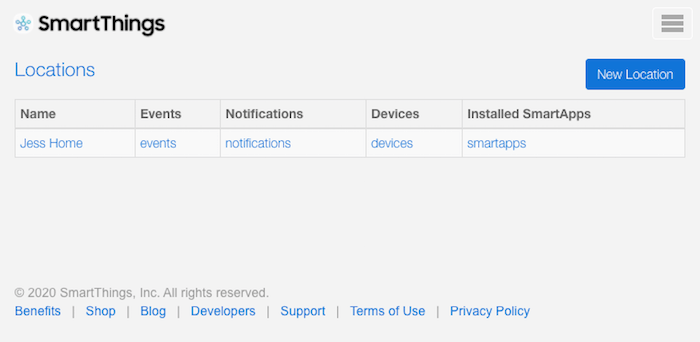
- In the toolbar, select “My SmartApps.”
- Click “New SmartApp.”
- Select the “From Code” tab.
- Paste your code into the subsequent window.
- Select the “App Settings” button.
- Click to expand the “OAuth” section and then select “Enable OAuth in SmartApp.”
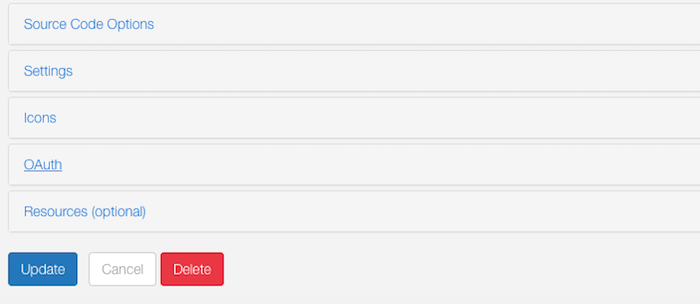
- Click the “Update” button.
- Select “Publish -> For Me.”
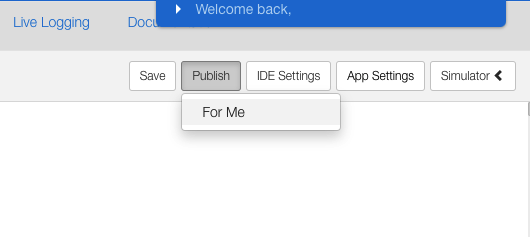
And that’s it! The Simple Event Logger app will now be accessible via your SmartThings mobile application.
Export your data to Google Spreadsheets
The data you can record will vary depending on which sensors you’ve connected to your Samsung SmartThings network.
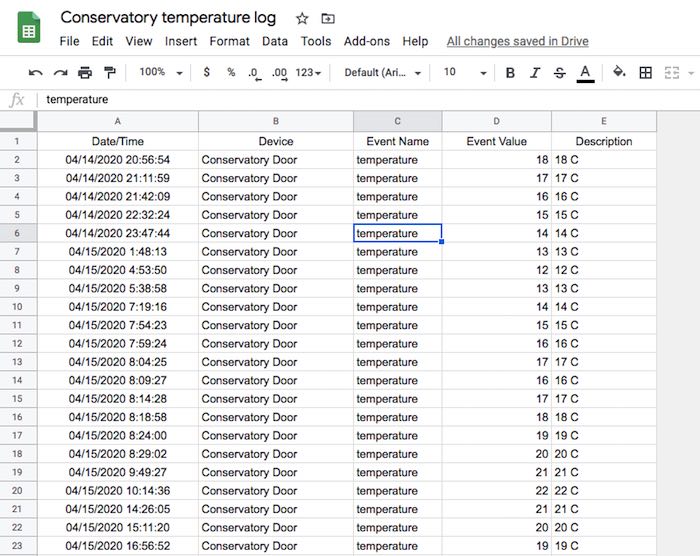
In my home, I use a Multipurpose sensor to monitor temperature. This tutorial will use Simple Event Logger to record temperature changes.
To get started, log into your Google account:
- Copy the Simple Event Logger code.
- Open the Google Sheets application.
- Create a new spreadsheet by selecting “Blank.”
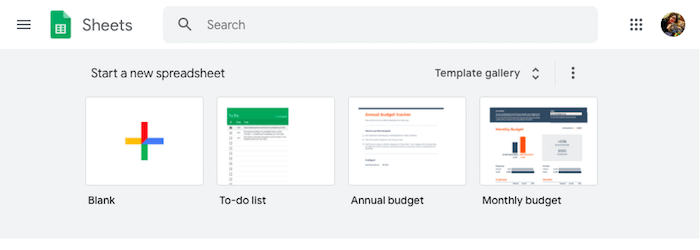
- Click the “Untitled spreadsheet” heading and give your spreadsheet a unique name. I’m using “Conservatory temperature log.”
- In the toolbar, select “Tools -> Script editor.”
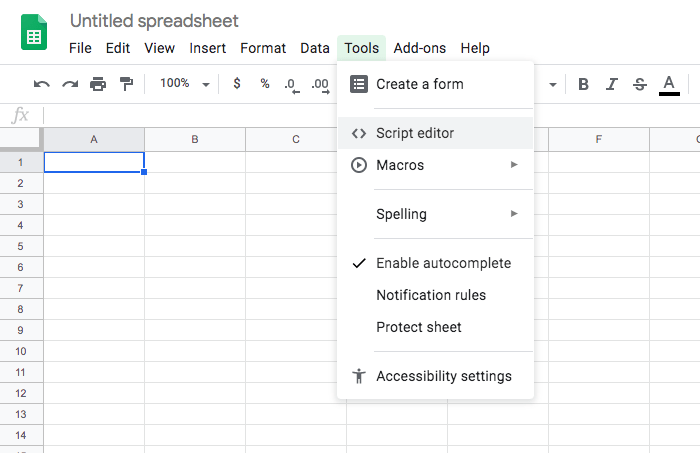
- Delete the existing code and then paste the Simple Event Logger code into this section.
- In the toolbar, select “Publish -> Deploy as web app … ”

- When prompted, give your project a name; This tutorial is using “Simple Event Logger.”
- Click “OK.”
- In “Project name,” open the drop-down and select “New.”
- Change the “Who has access to the app” field to “Anyone, even anonymous,” and then click “Deploy.”
- When prompted, select “Review Permissions.”
- In the subsequent popup, log in to your Google account, if prompted.
- Make a note of the “Current Web App URL,” as you’ll be needing this information shortly.
- Click “OK.”
Sending your SmartThings data to Google Sheets
Now set up this app on our smartphone or tablet and connect it to the spreadsheet that was created earlier:
- Launch the SmartThings mobile app.
- In the bar that runs along the bottom of the screen, tap “Automation.”
- Tap the “SmartApps” tab.
- Select “Add a SmartApp -> My Apps.”
- Tap “Simple Events Logger.”
- Select the sensor, actuator, or device you want to monitor.
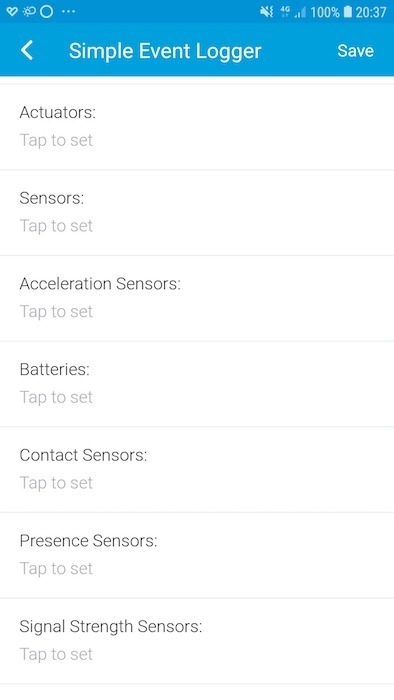
- Scroll to the “Choose Events” section and choose the event(s) that you want to record – for example, changes in temperature, battery level, or acceleration. When you’re happy with your selection, tap “Done.”
- Tap “Log Events Every” and specify how often this event should be logged. The available values range from five minutes to three hours.
- Tap “Maximum number of events to log for each device per execution” and choose between 1 to 200 events. Every time the Simple Event Logger runs, it can retrieve between 1 and 200 new events from a single sensor, actuator or device. If you try to retrieve too many events, this can cause Simple Event Logger to time out, but setting this value too low may result in some events not being logged. Unless you have a specific value in mind, it makes sense to stick with the app’s default values and then make some adjustments if you encounter any problems.
- The “Log Event Description” slider determines whether the event’s description is added to your spreadsheet. If you’re displaying multiple data sets in the same document, you should always leave this setting enabled.
- In “Google Sheets Web App URL,” paste the Web App URL you previously copied from your Google Sheet.
- Tap “Save.”
Now, Simple Event Logger will take all the data from your chosen sensor, actuator or device, and record it in your spreadsheet. Note that it may take a while for events to actually happen, so don’t panic if your spreadsheet isn’t immediately populated with data.
Make your data more accessible: creating a chart
Spreadsheets are great when you need access to exact figures, but they don’t make it particularly easy to identify trends or get a high-level overview of complex data.
Next you’ll learn how to display your Google Sheets data as a chart that’ll update automatically as new data becomes available.
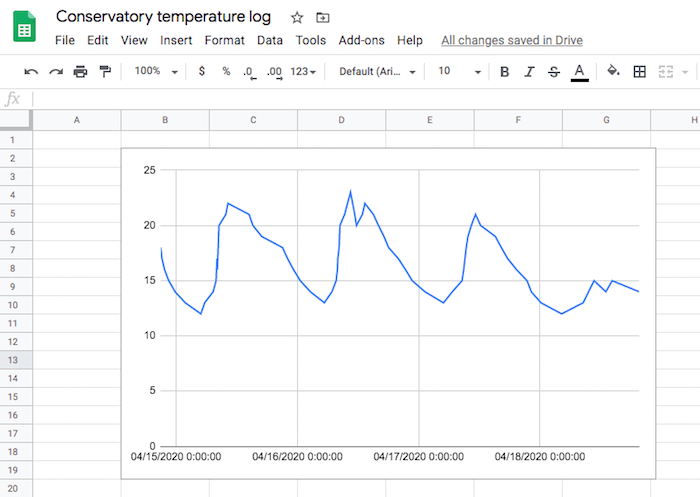
Click the little “+” icon in the bottom-left corner to create a new sheet,.
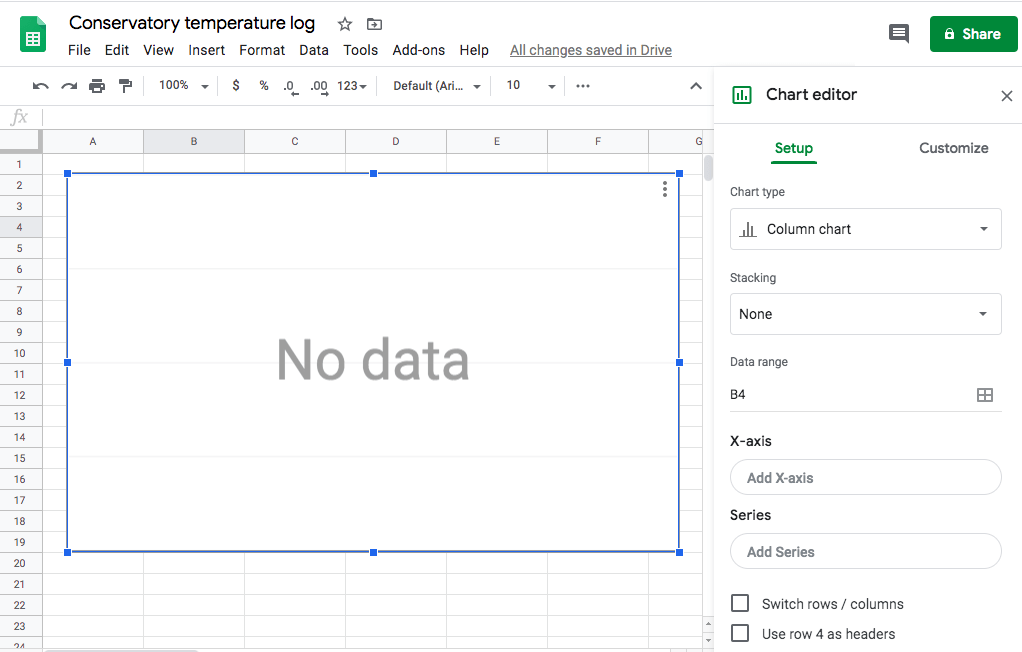
Navigate to the location where you want to place your chart. In the toolbar, select “Insert -> Chart,” which will launch Google’s Chart Editor.
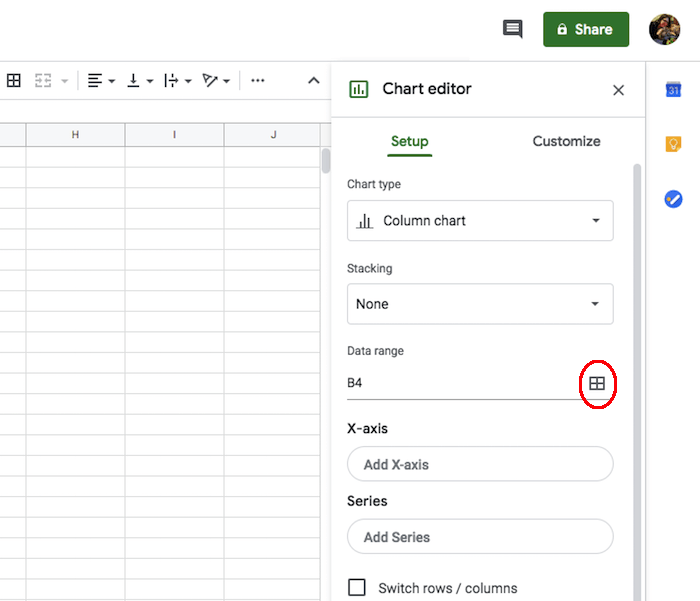
Find the “Data range” field, and select its accompanying “Select data range” icon (circled in the following screenshot). The “Select a data range” pop-up should now appear onscreen.
If your data is stored in a separate tab, then select that tab along the bottom of the screen. Don’t worry, as this won’t close the “Select a data range” popup.
Find the column that contains the data you want to display in your chart’s vertical Y axis and select that column’s header. This data range should now appear in the “Select a data range” pop-up.
Click “OK,” and all of this data will now appear in your chart.
For the horizontal X axis, you’ll typically want to display the time and date when each Y value was recorded. To add X axis data to your chart, double-click the chart, which re-opens the Chart Editor.
Make sure the “Setup” tab is selected.
Find the “X-axis” section and select “Add X-axis.”
Once again, click the little “Select data range” icon.
Navigate to the data that you want to add to your X axis and select its header.
Click “OK.” This data will now appear in your chart.
There are many ways to customize your chart. To take a look at your options, double-click your chart and select the “Customize” tab.
You can also switch between various styles of the chart by launching the Chart Editor panel, selecting “Setup” and then opening the “Chart type” drop-down.
That’s it. You have now successfully recorded data from your smart home sensor and displayed it as a chart in Google Spreadsheet. Use it to identify trends, issues and inefficiencies with your existing smart home setup. Also, identify areas where you may benefit by introducing some new smart home rules.

